Delhi Post-Diwali Smog Spike: How Real-Time AQI Hit 1,331 and Jumped 69% Over 2025
Delhi awoke to a toxic ceiling on November 9 as midnight firecrackers drove real-time AQI readings to 1,331, surging 69% above 2025's post-Diwali levels.
Verdict: false alarm.
Primary source: AQI.in real-time sensor network telemetry and Central Pollution Control Board (CPCB) official continuous air monitoring data →
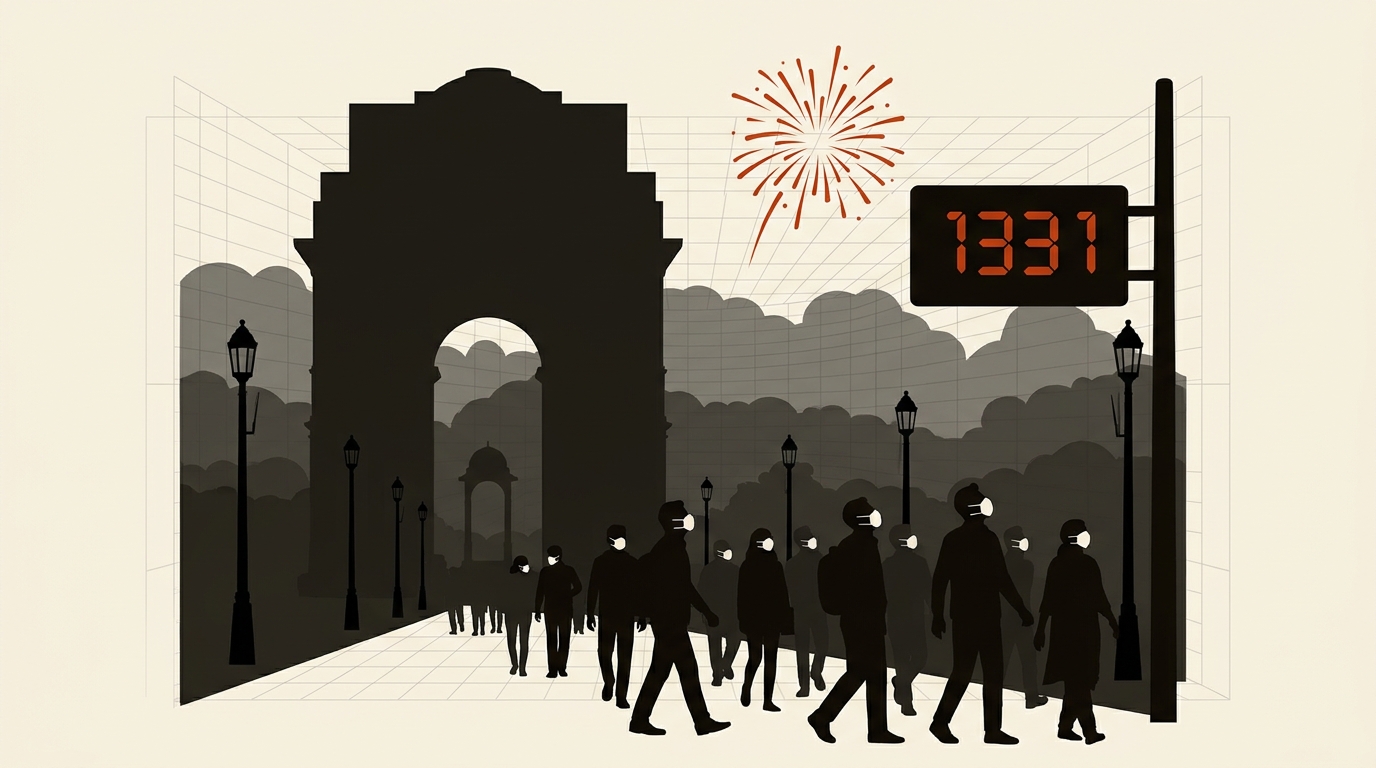
A 69% year-on-year surge in morning post-Diwali particulate levels exposes the total breakdown of festival firecracker bans and winter emergency mitigation.
Short answer: It was not a typical seasonal uptick. It was a severe environmental blowout. Real-time air quality monitors across Delhi recorded an off-the-charts spike during the early morning hours of Monday, November 9, 2026, peaking at a staggering 1,331 at 1:31 AM. By 8:01 AM, morning air quality lingered at 663, nearly 69% worse than the post-festival levels recorded in 2025. Widespread defiance of firecracker restrictions, colliding with stagnant sub-5 km/h winds and pre-existing crop residue smoke, created an impenetrable ceiling of hazardous particulate matter over thirty million residents.
Here is what continuous sensor telemetry reveals about the overnight surge, how it compares to last year, and why official averages tell only half the story.
1. The midnight surge: Minute-by-minute progression to 1,331
Public health advisories leading into the festival weekend had already warned that the National Capital Region had zero ecological buffer left to absorb fresh smoke. Yet continuous telemetry from the AQI.in monitoring network shows that pollution exploded exponentially once night fell on Sunday, November 8:
- 9:31 PM: Ambient air quality was already hazardous across outer rings, registering an initial reading of 681.
- 10:00 PM: The steepest curve began as localized firecracker celebrations peaked simultaneously in residential neighborhoods from Rohini to Noida.
- 11:00 PM: Particulate density shattered standard rating scales, rocketing to 1,153 across central sensor clusters.
- 1:31 AM (Peak Crisis): Citywide composite indices touched their highest single recorded point of the season at 1,331.
- 8:01 AM (Morning Commute): As nocturnal temperature inversion held steady, the morning reading remained frozen at an alarming 663.
To put a reading of 1,331 into perspective, any Air Quality Index measurement above 400 is officially categorized as “Severe” by the Central Pollution Control Board (CPCB), carrying immediate health warnings for healthy individuals and severe physiological stress for anyone with respiratory vulnerabilities. Touching numbers triple the severe threshold means atmospheric particulate concentrations reached levels comparable to standing directly inside a smoke plume.
2. The 2025 comparison: Why 2026 was 69% more toxic
Official spokespersons frequently attempt to normalize post-festival smog as an unavoidable annual ritual. But year-on-year historical comparisons demonstrate that 2026 saw a dramatic worsening of ambient toxicity.
On October 21, 2025, the morning following Diwali the previous year, the corresponding citywide AQI.in morning measurement stood at 393. While 393 is undeniably poor and harmful, Monday morning’s reading of 663 represents an extraordinary 68.7% jump in particulate concentration over a twelve-month span.
Why did 2026 deteriorate so much faster?
First, Diwali fell almost three weeks later in the calendar year compared to 2025. In late October 2025, autumn surface temperatures remained warm enough to allow thermal updrafts, allowing hot smoke to break through the lower atmosphere and disperse horizontally. By November 8 and 9, 2026, north Indian winter had firmly arrived. Cold, heavy nocturnal air clamped down over the plains like a concrete lid, trapping ground-level emissions within a shallow boundary layer only a few hundred meters high.
Second, firecracker compliance completely collapsed. Despite ongoing statutory bans on non-green firecrackers and Supreme Court restrictions on night bursting, enforcement teams reported widespread, sustained displays continuing past 2:00 AM across private housing societies and unauthorized commercial markets.
3. CPCB 24-hour averages versus real-time sensor spikes
Understanding the debate requires unpacking the difference between official government reports and real-time private monitoring arrays.
On the festival day itself (November 8), the official 24-hour average AQI released by the CPCB clocked in at 376, categorizing the air as “Very Poor.” Even as residents looked out their windows at blinding midnight smog, early official forecasts projected that Monday’s 24-hour composite would hover in the “Severe” band around 420 to 450.
How does an official government reading of 376 or 430 reconcile with private sensor feeds screaming 1,331?
- Time-Weighted Averaging: The official CPCB index calculates a trailing 24-hour rolling arithmetic average. A catastrophic four-hour midnight spike to 1,300 is mathematically averaged with the relatively cleaner afternoon hours of the preceding daylight period, effectively masking the extreme nocturnal peak.
- Sensor Scale Caps: Most regulatory station monitors are calibrated to statutory monitoring ceilings and truncate extreme spikes, whereas dense private optical particle counters capture immediate micro-peaks in raw particulate volume.
- Hyper-Local Exposure: As examined in our previous analysis of pre-Diwali air quality trends and crop residue burning contributions, ground-level exposure in narrow residential streets is far higher than the air sampled by elevated ambient monitoring stations atop government towers.
Both sets of numbers are mathematically correct within their defined methodologies, but relying solely on trailing 24-hour averages hides the severe acute danger faced by citizens breathing peak toxic air overnight.
4. The pre-existing crisis: How November entered the red zone early
Firecrackers did not create Delhi’s crisis out of thin air. They dropped an incendiary spark onto an already suffocating ecosystem.
Between late October and early November 2026, municipal sensors tracked a relentless march into hazardous territory:
- October 30: A brief spell of late-October rain and gusty winds cleaned the air down to a moderate 124.
- November 2: As precipitation dried up and northwestern transport winds aligned with the stubble burning belt in Punjab and Haryana, the index climbed rapidly to 393.
- November 3: Less than seventy-two hours later, regional monitors breached 464 by midday.
By the time festival night arrived, traffic exhaust, unchecked construction dust, unpaved road dust, and industrial emissions had already consumed whatever remaining air capacity the Indo-Gangetic basin possessed.
Similar to our reporting comparing Mumbai construction dust regulations with northern Indian seasonal smog and the technical limitations of regional environmental early warning networks, air quality crises cannot be solved by eleventh-hour administrative decrees. When municipal authorities fail to control baseline year-round sources, a single evening of celebratory smoke is enough to push an entire metropolis into a public health catastrophe.
Sources to check yourself
- Central Pollution Control Board (CPCB): Official 24-hour Air Quality Index bulletins and National Ambient Air Quality Monitoring network files.
- AQI.in Real-Time Air Quality Network: High-resolution temporal tracking charts and sensor distribution maps across Delhi-NCR.
- India Today Science Desk: Meteorological and sensor analysis by newsroom environment reporters covering post-Diwali smog.
- Delhi Pollution Control Committee (DPCC): Continuous Ambient Air Quality Monitoring Station (CAAQMS) live portal records.
Frequently asked questions
Q: Why did Delhi’s AQI reach 1,331 on AQI.in while official CPCB reported numbers around 400? A: The Central Pollution Control Board publishes a 24-hour rolling average, which dilutes acute midnight spikes by blending them with cleaner daytime hours. AQI.in reports instantaneous, real-time measurements that reflect the immediate peak concentration of particulate matter occurring right after midnight.
Q: Why was the 2026 post-Diwali smog worse than 2025? A: Diwali in 2026 occurred in early November rather than late October, meaning colder winter surface temperatures and lower wind speeds (< 5 km/h) created a strong temperature inversion that trapped firecracker emissions at breathing level instead of allowing them to disperse into the upper atmosphere.
Q: Did stubble burning cause the midnight jump to 1,331? A: No. Paddy stubble burning in neighboring states created the high baseline pollution (AQI 350 to 450) leading into the weekend. However, the sudden spike from 681 at 9:30 PM to 1,331 at 1:31 AM was directly caused by intense, localized firecracker bursting concentrated over a five-hour window.
Reader discussion
Conversation for this story opens with memberships. Until then: found an error? Report it — we correct visibly.